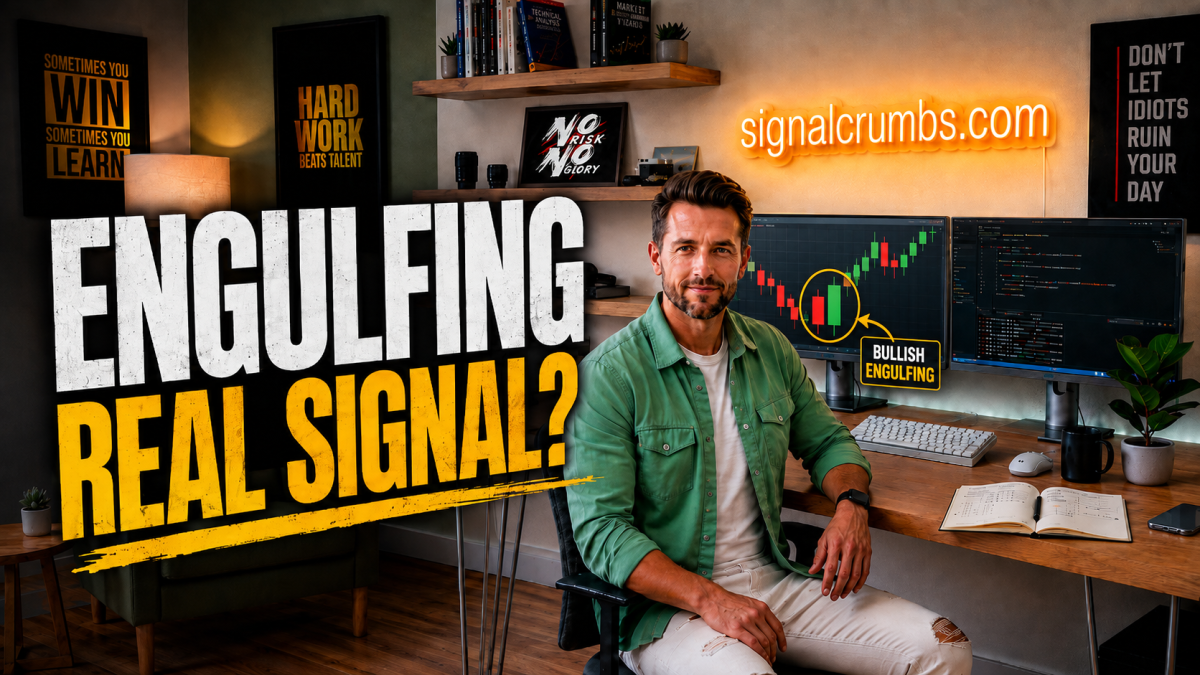
Engulfing is one of the first candlestick patterns many traders learn when they begin studying technical analysis. The textbook explanation sounds simple: Bullish Engulfing suggests a potential reversal to the upside, while Bearish Engulfing suggests the opposite. The logic is intuitive because one side of the market appears to be in control, then the following candle moves strongly enough in the opposite direction to engulf the previous candle’s body.
The problem is that this immediately raises a much more important question. If a Bullish Engulfing appears, should you simply buy? If a Bearish Engulfing appears, should you automatically sell? Research suggests that Engulfing patterns can contain useful short-term information under certain conditions, but that is very different from saying that one candle can reliably predict where the market will go next.
The real value of an Engulfing pattern is not that it predicts the future. It can show that the short-term balance between buyers and sellers has changed.
What Exactly Is an Engulfing Pattern?
A classic Bullish Engulfing formation consists of two candles. The first is bearish, meaning it opens higher and closes lower. The second candle is bullish, and its body completely engulfs the body of the previous candle. A Bearish Engulfing is the reverse: a bullish candle is followed by a larger bearish candle whose body engulfs the previous bullish body.
Traditionally, the body is the important part, so the second candle does not necessarily need to engulf the previous candle’s full range including the wicks. But this is already where subjectivity enters the picture. Some traders require only body engulfing, others want the entire range engulfed, some introduce minimum candle-size rules, and others require a clearly defined prior trend.
That matters because before asking how well Engulfing works, we first need to define exactly what qualifies as an Engulfing pattern. Without an objective definition, two traders can test what appears to be the same concept and end up testing different things.
Researchers Have Tested Engulfing Patterns Statistically
A 2021 study specifically examined Bullish and Bearish Engulfing patterns on the S&P 500 using daily data from 1950 through 2020. The conclusion was not that Engulfing is useless, but it was also far from discovering a universal money-printing candle.
Bearish Engulfing showed strong short-term predictive ability under certain Open and High criteria, while the same strength did not appear when the next Close was used as the evaluation point. Bullish Engulfing showed similar short-term predictive power under certain Open and Low criteria, but again the effect was not clearly present when measured through the Close.
This distinction is extremely important. A pattern can contain statistically measurable information about future short-term highs, lows, or opening behavior without reliably predicting where the next candle will eventually close.
Statistical Information Is Not the Same as Directional Prediction
Beginners often imagine Engulfing patterns in a binary way: Bullish Engulfing appears, so the next candle goes up; Bearish Engulfing appears, so the next one goes down. The research suggests something more subtle. The pattern may contain information about certain parts of the next period without accurately forecasting its final direction.
Saying that something contains statistical information is therefore not the same as saying that it tells us where the market is going. Those are two very different claims, and confusing them is one of the easiest ways to turn a useful observation into an overly confident trading rule.
Does a Larger Engulfing Candle Mean a Stronger Signal?
It sounds logical to assume that a larger Engulfing candle should create a stronger signal. If the second candle barely covers the first, perhaps the reversal is weak; if it is several times larger, perhaps the signal is much stronger.
Interestingly, the S&P 500 study did not find the size of the Engulfing candle to be a statistically significant factor in the pattern’s success. Even more surprising, the prior trend was not statistically significant in that particular study either, despite traditional candlestick education usually teaching that Bullish Engulfing should appear after a downtrend and Bearish Engulfing after an uptrend.
That does not prove that trend or candle size never matter. It does show why rules from trading books should be tested instead of accepted automatically simply because they sound intuitive.
There Is No Universal Engulfing Win Rate
Research on Chinese equities produced different results again. In the tested period, Bullish Engulfing was profitable for certain high-liquidity, smaller-cap stocks, while other patterns and other groups of stocks behaved differently.
That is why claims such as “Bullish Engulfing works 73% of the time” are almost meaningless without context. Seventy-three percent on which market? S&P 500, EUR/USD, Bitcoin, Tesla? On a daily chart or a five-minute chart? With what entry, exit, Stop Loss, holding period, and transaction costs?
Until those questions are answered, the percentage is little more than a headline.
What Is an Engulfing Pattern Really Showing?
Forget the name for a moment and look at the actual price behavior. During the first candle of a Bullish Engulfing sequence, sellers dominate and price closes lower. During the next period, buyers become strong enough not only to reverse that decline but to push the closing price beyond the entire body of the previous bearish candle.
That tells us something concrete: the short-term balance between buyers and sellers changed. It does not tell us that price must continue rising afterward. Treating the pattern as evidence of a momentum shift rather than a prediction makes it much more useful.
Location Can Matter More Than the Pattern Itself
Imagine two Bullish Engulfing patterns on EUR/USD. In the first example, price is moving sideways in the middle of an unimportant range with no significant support, resistance, trend, or unusual market behavior nearby. One green candle simply happens to engulf the previous red candle.
In the second example, EUR/USD has been declining for several days and reaches a price zone where strong buying has repeatedly appeared before. Price briefly trades below support, fails to stay there, moves back above it, and then forms a Bullish Engulfing candle.
Geometrically, the two patterns may look almost identical. Informationally, they are very different because the second setup contains support, a failed breakdown or liquidity sweep, rejection, and a short-term momentum shift at the same time.
The setup does not become interesting because an Engulfing pattern appeared. The Engulfing pattern becomes interesting because it appeared in an important market situation.
Trade Situations, Not Candlestick Names
Instead of scanning a chart for the next Bullish or Bearish Engulfing candle, it may be more useful to first identify where the market itself becomes interesting. That can involve trend, pullbacks, support, resistance, volatility, previous highs and lows, or broader market structure.
If an Engulfing pattern then appears inside that situation, it becomes an additional layer of information. The candlestick does not create the setup from nothing; it helps describe what is happening inside a setup that already has context.
A Simple Bullish Example
Suppose USD/JPY is in a longer-term uptrend and the market begins to pull back. Price reaches a previous support zone, while RSI or Z-Score also suggests that the short-term decline has become relatively extended. A Bullish Engulfing pattern then appears.
Now several pieces of information are aligned: the longer-term trend is bullish, the current move looks like a correction, price has reached support, short-term momentum appears stretched, and the Engulfing candle shows that buyers have regained short-term control.
That is far more interesting than seeing the same formation at a random location. Even then, it does not automatically become a trade; it becomes a setup worth investigating.
The Same Logic Applies to Bearish Engulfing
Imagine price rising toward an established resistance zone or previous swing high. It briefly trades above the old high but cannot remain there, buyers fail to continue the advance, and a Bearish Engulfing forms.
Now there is a coherent story behind the candle. Higher prices were rejected, buyers failed to extend the move, and sellers stepped in strongly enough to erase the previous bullish body. That is useful information, but it is still not a guarantee that the market will reverse.
Volume Can Add Another Dimension
In stocks and futures, volume can provide additional information around an Engulfing pattern. If a Bullish Engulfing appears together with a significant increase in volume, it may suggest that the shift in price behavior occurred alongside greater market participation.
Spot Forex is more complicated because there is no single centralized global exchange displaying complete spot FX volume. In that environment, traders may focus more heavily on volatility, higher-timeframe structure, price zones, and possibly futures or broker-specific volume data.
The broader principle is the same: another dimension of information can often be more valuable than simply finding a more visually impressive candle.
Why Trading Every Engulfing Pattern Can Be Dangerous
Engulfing formations are not rare, especially on lower timeframes. Open a five-minute chart and search for every two-candle sequence where the second body engulfs the first, and opportunities will appear constantly.
If every occurrence becomes a position, overtrading can quickly become the real strategy. More trades mean more spread, commission, Slippage, and exposure to market noise. Even if a small statistical edge exists before costs, execution can remove much of it.
A 2023 study across 41 equity markets analyzed more than 6,400 technical trading rules and found that their performance weakened substantially over time, out-of-sample persistence was poor, and even moderate transaction costs eliminated many historical advantages. The research was not specifically about Engulfing patterns, but the broader lesson is highly relevant: a statistical edge is not automatically a tradable edge.
Timeframe Changes What the Pattern Represents
A daily Bullish Engulfing summarizes an entire trading day, while a one-minute Bullish Engulfing summarizes sixty seconds. The geometry may look similar, but the amount and type of information inside the candle are very different.
On a short timeframe, a single large order, news reaction, spread change, or temporary liquidity event can create a dramatic candle. That is why the first question after hearing that Engulfing “works well” should often be: on what timeframe?
This does not mean one-minute charts are bad and daily charts are good. The timeframe simply changes what is being measured. A five-minute candle reflects short-term intraday behavior, while a daily candle compresses a full day and a weekly candle an entire week.
The Confirmation Dilemma
Suppose a Bullish Engulfing appears in an interesting location. Should the trade be entered immediately when the candle closes, or should you wait for another bullish candle, a break above the Engulfing high, or even a new swing high?
Waiting provides more evidence, but usually at a cost. The longer you wait, the more confirmation may appear, while the entry price becomes less attractive. This creates one of trading’s permanent trade-offs: enter earlier with a better price and greater uncertainty, or enter later with more confirmation and a worse price.
No method gives maximum certainty and a perfect entry at the same time. Which approach produces the better expectancy is something that has to be tested.
The Stop Loss Is Part of the Strategy Too
Even after deciding to trade the pattern, another major question remains: where is the idea invalidated? Below the Engulfing low, below the entire support zone, below the previous swing low, through an ATR-based distance, or through a fixed percentage?
Every one of those decisions creates different risk characteristics and different historical results. The Engulfing pattern may be one element of the entry logic, but a complete strategy still needs position sizing, risk management, exit rules, and a clear definition of when the original idea is considered wrong.
A pattern is not a strategy. Entry, Stop Loss, position size, exit logic, and the definition of failure determine whether the pattern can become part of a usable system.
Take Profit Changes the Statistics Just as Much
Imagine two strategies using the same Engulfing entry. Strategy A risks $100 to make $100, while Strategy B risks the same $100 but aims for $300. Their win rates will almost certainly differ because the larger target will be reached less often, even though each successful trade produces a larger payoff.
That is why saying “Engulfing is 65% successful” is incomplete. Successful at what? The next candle closing higher? Reaching 1R, 2R, or 5R? Making a higher high? Trading higher one week later?
Those are completely different statistical questions, and this is exactly what the S&P 500 research illustrated when the same pattern looked statistically successful under some Open, High, and Low definitions but not under the Close criterion.
Overfitting Can Produce Incredible Historical Results
Suppose a basic Engulfing strategy performs poorly, so RSI below 30 is added. Then a 200-period moving average. Then only Tuesdays and Thursdays, a specific time window, a minimum ATR, and an exact body-size ratio. Eventually, the backtest produces a spectacular win rate.
That may look impressive, but there is another possibility: the rules were fitted perfectly to historical noise. If enough combinations are tested on the same dataset, some will appear exceptional purely by chance.
This is the problem of data snooping and overfitting. It is why out-of-sample testing, statistical corrections, forward testing, and evaluation across different market regimes are necessary before treating a historical pattern as robust.
Turn the Pattern Into Objective Rules
One useful way to test an Engulfing idea is to make every part of it measurable. For example, define the first candle as bearish, the second as bullish, require the second body to fully engulf the first, specify minimum body size, maximum wick ratio, minimum prior movement, timeframe, and instrument.
Once the pattern is objective, it can be tested hundreds or thousands of times across multiple years and market regimes, followed by out-of-sample and forward testing. The conclusion then becomes much more precise: “With these exact rules, on this market and timeframe, this is what the data showed.”
That is a much more useful statement than simply saying that Engulfing works.
Automation Can Expose Visual Bias Very Quickly
Manual chart review can make Engulfing patterns look spectacular because the human brain remembers the dramatic examples. One Bullish Engulfing is followed by a 300-pip rally, one Bearish Engulfing appears before a major decline, and those examples become easy to recall.
Once the rules are coded and every occurrence is tested, the result may turn out to be completely ordinary. That can actually be valuable because automated testing forces the less memorable failures back into the sample instead of allowing them to disappear from memory.
Why Is Engulfing So Popular Then?
Because it is genuinely useful visual information. The formation is easy to recognize and can clearly show that momentum changed between two consecutive periods. In one glance, the trader can see which side dominated the first candle and whether the opposing side managed to erase that move during the next.
The mistake comes when the observation becomes a conclusion that the entire market must now reverse. A more useful interpretation is: “We have evidence of a short-term momentum shift. What else is happening around it?”
What Can Be Combined With Engulfing?
A practical setup can combine several partially independent pieces of information: higher-timeframe trend, support or resistance, market structure, volatility, an extreme Z-Score reading, failure to make a new low or high, and the Engulfing pattern itself.
This is what traders often call confluence. The goal is not to stack five indicators that all measure the same version of momentum, but to combine information from different parts of the market structure that supports a similar thesis.
The Next Candle May Matter More Than the Engulfing Pattern
Once the pattern has formed, the market keeps moving. Does price immediately break above the Bullish Engulfing high? Does it fall back into the middle of the pattern? Does it break below the Engulfing low?
The Engulfing formation is only a snapshot. Subsequent price action can often reveal more about whether a genuine change occurred than the name of the original pattern itself.
A Failed Engulfing Pattern Can Be Useful Information Too
Suppose a textbook Bullish Engulfing appears and traders become optimistic, but instead of continuing higher, price fails to follow through and eventually breaks below the Engulfing low. The bullish setup that appeared strong has failed.
That failure itself can reveal information. Buyers may not have been as strong as they initially appeared, or selling pressure may be stronger than expected. This does not mean the trader should automatically short every failed Bullish Engulfing, but when the market does the opposite of what the original setup suggested, that deviation is worth investigating.
A failed technical signal can sometimes reveal as much as a successful one because it shows that the market refused to behave according to the original thesis.
An Engulfing Pattern Is Not a Prediction
When a Bullish Engulfing appears, the observable fact is not that the market is going up. The fact is that during that period, buyers clearly took back short-term control.
The next questions are why that happened and whether the change is sustainable. Was the market at support? Was the longer-term trend favorable? Did news create the move? Was liquidity involved? Was it simply random volatility? The Engulfing candle itself cannot answer those questions.
So How Reliable Is Engulfing From 1 to 10?
Assigning one universal score would be misleading because an Engulfing pattern does not exist in a vacuum. The same geometry appearing in the middle of a random five-minute chart and on a daily chart at major monthly support represents two completely different trading situations.
That is why trying to measure the reliability of the Engulfing pattern itself is probably the wrong objective. A more useful question is how reliable the entire setup becomes once the market, timeframe, trend, location, entry, exit, transaction costs, and risk management are included.
Final Thoughts
Research suggests that Bullish and Bearish Engulfing patterns can contain statistically measurable short-term information in certain markets and under certain definitions. The multi-decade S&P 500 study, for example, found stronger results under particular Open, High, and Low criteria while the same predictive effect did not appear under the Close criterion.
Other markets have also produced historical samples where Bullish Engulfing strategies performed well within specific groups of stocks. None of that means Bullish Engulfing equals buy or Bearish Engulfing equals sell.
The pattern’s real value is that it can visually communicate a short-term change in the balance between buyers and sellers. Whether that change becomes a worthwhile trading opportunity depends on the market, timeframe, trend, location, entry method, exit method, transaction costs, and risk-management framework surrounding it.
The next time a beautiful Engulfing pattern appears, instead of asking “Buy?” or “Sell?”, ask a better question: Why did it form here?
If you would like to learn more about how we think about market structure, indicators, systematic testing, and automation inside our own trading system, you can find educational material and observe how the system operates at SignalCrumbs.com .
 Related posts