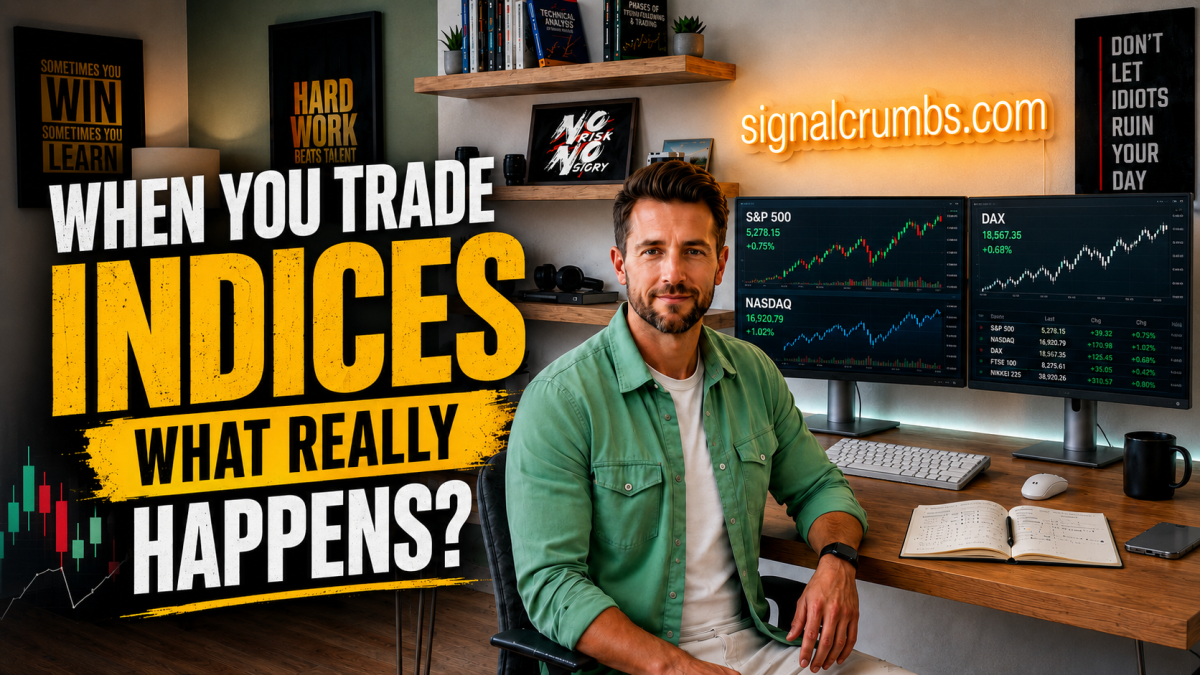
The S&P 500, Nasdaq-100, Dow Jones, DAX, FTSE, and Nikkei are among the best-known financial-market benchmarks in the world. Even people who have never traded an index have usually heard at least some of those names. But there is a basic question that is easy to skip: when you open a position on something like the S&P 500, what are you actually buying?
You are not directly buying five hundred different stocks, and you are not buying one giant company that somehow represents the U.S. market. In many cases, you are not buying any stock at all. An index itself is essentially a rules-based calculation designed to summarize the performance of a defined group of securities into one number.
The S&P 500, for example, represents large-cap U.S. equities and uses float-adjusted market-cap weighting. The Nasdaq-100 follows 100 of the largest non-financial companies listed on Nasdaq and uses modified market-cap weighting. The interesting part begins when we ask how a calculation like that can become something you can actually buy or sell.
An index is a benchmark. The ETF, futures contract, CFD, or option you use to trade that benchmark is a separate financial product.
An Index Is Not a Company
Buying Apple means purchasing shares in a specific company. The same is true for Coca-Cola or Nvidia. The S&P 500 is fundamentally different because there is no S&P 500 factory, CEO, quarterly earnings report, or operating business behind the index itself.
Instead, an index takes the price movements of many underlying companies and compresses them into one benchmark. The S&P 500 represents 500 leading U.S. large-cap companies, but those companies do not all influence the index equally. Understanding the weighting methodology is therefore one of the first things an index trader should learn.
The S&P 500 Is Not Equally Weighted
A useful analogy is to imagine 500 people voting, except they do not all receive one vote. The largest participants may receive several votes, while a much smaller participant may receive only a tiny fraction of one. That is broadly how a market-cap-weighted index behaves.
In the S&P 500, float-adjusted market capitalization determines how much influence each company receives. The larger the publicly tradable market value of a company, the more heavily its price movement can affect the index. A 2% move in a mega-cap company can therefore matter much more than the same 2% move in a small component.
“The S&P 500 Rose 1%” Does Not Mean Every Stock Rose 1%
An index can finish higher even when a large number of its components decline. It is possible for 200 stocks to rise, 300 to fall, and the index still to close positive if the largest-weighted companies move strongly enough.
This is why market breadth matters. Breadth looks beyond the headline index return and asks how widely participation in the move is distributed. A rally driven by hundreds of companies is very different from one driven primarily by a handful of mega-cap stocks, even if the index closes at the same percentage gain.
Index Concentration Can Be Much Higher Than It Looks
In 2026, the concentration of the S&P 500 made this especially visible. At one point, the ten largest companies represented more than one-third of the entire index. That is a remarkable amount of influence for only ten companies inside a benchmark containing 500 names.
An investor in the S&P 500 is certainly more diversified than someone holding a single stock, but that does not mean they have equal exposure to 500 companies. The difference between “500 components” and “500 equally weighted components” is extremely important.
The Nasdaq-100 Uses a Different System
The Nasdaq-100 tracks 100 large non-financial companies listed on Nasdaq and uses modified market-cap weighting. The word “modified” matters because pure market-cap weighting can allow the largest companies to become extremely dominant.
Nasdaq therefore uses weighting limits and rebalancing rules that prevent individual mega-cap companies from gaining unlimited influence. This illustrates an important principle: the name of an index tells you very little about its internal mechanics. You need to know which companies are included and how their weights are calculated.
The Dow Jones Works Differently Again
The Dow Jones Industrial Average is price-weighted rather than market-cap-weighted. That means the share price itself plays an important role in determining a company’s influence on the benchmark, rather than the company’s total market capitalization alone.
The S&P 500, Nasdaq-100, and Dow Jones are all major U.S. equity indexes, but they are not constructed in the same way. That affects how they react when individual components move.
Trading an Index Means Taking a View on a Group of Companies
When you buy an individual stock, your thesis may revolve around a CEO, new product, earnings report, scandal, factory expansion, lawsuit, competitor, or other company-specific event. With an index, those issues still matter, but they matter through their combined effect on the wider basket.
The decision becomes closer to saying, “I believe the combined valuation of this group of companies is going to move in this direction.” That is a much broader statement than saying one particular company is attractive.
Company-Specific News Can Still Move an Index
Suppose Nvidia receives unexpectedly bad news. If you own Nvidia shares directly, the effect is immediate. If you trade the S&P 500, the news can still matter through Nvidia’s weight in the index and through the broader reaction across semiconductor, technology, AI-infrastructure, and growth stocks.
In that sense, company-specific news can spread through the system. A major component does not exist in isolation because investors may reinterpret an event as information about an entire sector or theme.
Macroeconomics Often Matters More for Indices
The reverse can happen as well. A company can report excellent earnings, strong revenue growth, and optimistic guidance while the overall market falls because the central bank turns unexpectedly hawkish, bond yields surge, or risk sentiment deteriorates.
Index traders therefore often pay close attention to interest rates, inflation, employment data, economic growth, central-bank communication, bond yields, earnings season, risk appetite, and the largest-weighted index components. The index represents a group, so broad macroeconomic forces frequently have more influence than they would on a purely company-specific thesis.
The Index and the Product Used to Trade It Are Not the Same Thing
Suppose a platform displays symbols such as US500, SPX500, NAS100, USTEC, GER40, or UK100. Pressing Buy does not automatically mean the same thing on every platform. What happens depends on the product behind that symbol.
The index is the underlying benchmark. The ETF, futures contract, CFD, or option used to gain exposure to it is the wrapper. Different wrappers can create very different leverage, cost, liquidity, settlement, expiration, and risk characteristics.
Trading an Index Through an ETF
An index ETF generally attempts to track the performance of a specific index. In that case, you purchase shares of a fund rather than buying the numerical index itself. The fund then uses its structure and holdings to replicate or approximate the benchmark.
ETFs are naturally suited to investment-style exposure because they can be bought and held for long periods. The investor owns an interest in the fund rather than entering directly into a derivative contract with an expiration date or leveraged margin structure.
Trading Index Futures
Equity-index futures are derivatives. Contracts such as E-mini S&P 500 futures or Micro E-mini S&P 500 futures provide exposure to movements in the underlying benchmark, but the trader does not receive pieces of all 500 companies when the contract expires.
These contracts are generally cash-settled. Their value changes with the market, and the final economic settlement occurs through cash rather than through delivery of a basket of stocks.
Futures and the Cash Index Do Not Have to Show the Same Price
The futures price can differ from the cash index because it reflects additional variables. Financing costs, expected dividends, time remaining until expiration, and the current spot index level all influence the relationship.
The two prices are closely linked, but they are not required to be identical at every moment. Seeing a difference between the S&P 500 cash index and its futures contract does not automatically mean something is wrong.
Trading an Index Through a CFD
On many retail Forex-style and MT5 platforms, symbols such as US500, NAS100, GER40, or UK100 may represent CFDs. A CFD does not mean you own the underlying index or all of the stocks inside it. You are entering a derivative contract whose value is linked to movements in the underlying benchmark.
This distinction is fundamental because CFDs can introduce leverage, margin requirements, spreads, financing charges, and broker-specific contract specifications. Two traders looking at the same index chart can therefore experience very different financial outcomes depending on the product and position size they use.
Leverage Can Transform the Risk Completely
Suppose you have a $1,000 account and use a derivative to control $10,000 of index exposure. A 1% move in the index represents $100 on the $10,000 position, which is 10% relative to the $1,000 account balance.
The underlying benchmark may have moved only 1%, yet the effect on the trader’s account is ten times larger in percentage terms. This is why saying that an index is relatively stable compared with an individual speculative stock tells only half the story. The index may be less volatile, but leverage can make the account extremely volatile.
Diversification reduces company-specific risk. Leverage can simultaneously increase position risk. Both can exist in the same trade.
Underlying Risk and Position Risk Are Different
This is one of the most important paradoxes of index trading. An index reduces the effect of a single company-specific disaster because one stock represents only part of the basket. But a highly leveraged index position can still expose the trader to enormous financial risk.
There is no contradiction between saying an index is more diversified than a single stock and saying a leveraged index trade can be extremely dangerous. The first statement describes the underlying asset. The second describes the way the trader sized and financed the position.
What Happens If One Component Collapses?
If you own one company and it suffers a scandal, disastrous earnings, a CEO resignation, or another major shock that sends the stock down 40%, the loss directly affects the entire position. Inside an index, the same decline may have a much smaller overall effect if the company represents only a tiny weight.
That is one of the core benefits of diversification. Individual company risk can be diluted across a broader portfolio.
Diversification Does Not Remove Market-Wide Risk
The protection disappears when the problem is not one company but the market itself. Recession fears, liquidity shocks, financial crises, geopolitical events, or major central-bank surprises can cause investors to sell large parts of the equity market simultaneously.
An index containing hundreds of companies can still experience a significant drawdown. Diversification reduces idiosyncratic company-specific risk; it does not eliminate systematic market risk.
Indices Make Broad Short Positions Easier Too
Suppose you believe U.S. technology stocks are temporarily overvalued and expect a correction. Instead of shorting ten separate technology stocks, one derivative linked to the Nasdaq-100 can express that broader view with a single position.
That efficiency works in both directions. Buying NAS100 is not simply saying you like one particular company. It is a much broader statement about a major group of U.S. growth and technology-oriented businesses, which also makes it easy to take a large macro position without fully appreciating how broad the exposure has become.
Position Sizing Depends on the Value of One Point
Seeing an index at 5,000 points does not tell you how much money is at risk. The important question is how much one point of movement is worth for the exact contract being traded.
If one point equals $10, then a 50-point move represents $500. If one point equals $1, the same chart movement represents $50. The market moved exactly the same amount, but the financial result differs by a factor of ten.
This is why saying “I opened 0.1 lots” is not enough. Traders need to know what that volume actually represents for the specific instrument and broker contract.
An Index Point Is Not a Forex Pip
Traders coming from Forex are accustomed to thinking in pips. EUR/USD and USD/JPY are generally discussed that way, while the S&P 500 and Nasdaq are usually described in index points.
The monetary value of one index point depends on the product. A CFD, Micro futures contract, and E-mini futures contract can assign very different financial values to the same one-point move. Checking the contract specification is therefore essential before calculating position size.
Stop-Loss Distance Alone Does Not Define Risk
A stop loss placed 100 points away tells us almost nothing by itself. If one point represents $1, the risk may be $100. If one point represents $10, the same technical stop represents $1,000.
A more logical sequence is to identify where the setup becomes invalid, measure the distance to that level, decide how much money can reasonably be risked, and then calculate the position size that fits those conditions. Opening a fixed position size first and searching for a stop afterward reverses that process.
Index Price Action Can Sometimes Look Cleaner
A single stock can move dramatically because of an earnings surprise, FDA decision, takeover offer, accounting problem, management scandal, or other company-specific shock. In a broad index, the effect of many individual events can be partially averaged out.
This does not mean index trading is easy or predictable. It simply means that single-company event risk can play a smaller role in a diversified benchmark than in an individual equity.
Indices Can Be Extremely Sensitive to Macro Releases
The Federal Reserve, CPI, NFP, GDP, bond yields, interest-rate expectations, earnings season, and changes in risk sentiment can all move major indexes quickly. A technical setup that looks excellent on the chart may be sitting only minutes away from a major macroeconomic release.
Saying “I do not care about news because I only trade the chart” can therefore be dangerous in index trading. The chart is not separate from macroeconomics; it is often reacting directly to changes in economic expectations.
Different Indices Have Different Personalities
The S&P 500 represents broad U.S. large-cap exposure. The Nasdaq-100 has a different sector structure and a stronger connection to large non-financial Nasdaq-listed companies. The Dow contains only thirty components and uses price weighting, while European and Japanese indexes reflect different economies, sectors, currencies, and investor bases.
Saying “I trade indices” is therefore almost as vague as saying “I drive vehicles.” A Ferrari, truck, and family sedan are all vehicles, but their characteristics are very different.
Correlated Indices Are Not Independent Positions
The S&P 500, Nasdaq-100, and Dow often move in the same general direction, but not by the same amount. Technology leadership may make the Nasdaq stronger, while a rally led by financials, industrials, or other sectors can produce a different pattern.
Opening long positions in all three does not necessarily create three independent ideas. A major risk-off event can pressure all of them simultaneously because the underlying exposure is still largely U.S. equities.
Count risk factors, not just positions. Three correlated index trades can still represent one large macro bet.
This Problem Exists Outside Index Trading Too
A trader might hold EUR/USD long, GBP/USD long, gold long, and USD/JPY short and believe they have four separate trades. Technically they do, but economically they may have created four variations of the same weaker-U.S.-dollar thesis.
The same logic applies to the S&P 500, Nasdaq, and Dow. Multiple positions can still represent one concentrated directional view. Risk management therefore requires understanding what is actually driving the positions underneath the surface.
What Happens When the Cash Market Is Closed?
The underlying stock market has official trading hours, but index futures often trade for much longer. While the U.S. cash market is closed, Asia can react to new information, Europe can open, futures can move, and global news can continue changing expectations.
When the New York cash market opens, the index can begin at a significantly different level from the previous close. That creates a gap on the cash chart.
A Gap Does Not Mean the Market Stopped Existing Overnight
A gap simply reflects the fact that the cash market was closed while the rest of the world continued processing information. Other markets and derivatives were still trading, new information arrived, and when the underlying stock exchange reopened, prices adjusted to the new reality.
The blank area on the cash chart is therefore not mysterious. It is a consequence of trading hours.
Holding an Index CFD Overnight Can Create Additional Costs
Overnight CFD positions may be subject to financing charges, swap or financing adjustments, dividend adjustments, and different spreads during certain periods. The exact structure depends on the broker and contract specification.
Holding an index exposure for a month through a CFD can therefore have a very different cost profile from holding an ETF or using futures. The underlying benchmark may be the same, but the product wrapper changes the economics of the trade.
Index Trading Actually Involves Two Separate Decisions
The first decision is directional: what do you think about the index, on what timeframe, and why? Are you bullish, bearish, or neutral? The second decision is structural: which product should you use to express that view?
ETF, futures, CFD, and options can differ in leverage, expiration, liquidity, trading hours, costs, settlement, and margin requirements. Choosing the product is therefore part of risk management rather than a minor technical detail.
Why Traders Like Indices
Index trading provides an elegant way to express a broad market view. You do not have to choose between Apple and Microsoft, Bank of America and JPMorgan, or Coca-Cola and Pepsi if your thesis is simply that U.S. large-cap equities will rise.
A benchmark such as the S&P 500 can express that broader idea through one position. That simplicity is one of the major attractions of index trading.
Be Careful With the Phrase “The Market”
Financial headlines often say that “the market was up,” but the phrase hides a lot of information. The S&P 500 could be up 0.5% while small-cap stocks decline. Technology may rally while banks fall, or the Nasdaq may outperform while the Dow struggles.
An index is a representation of a defined basket. It is not automatically the entire stock market, and it is certainly not the entire economy.
The Stock Market and the Economy Are Not the Same Thing
Beginners are often confused when bad economic data is followed by rising stock prices. The reaction makes more sense when we remember that markets do not price only what is happening today; they also price expectations about what may happen next.
Weak economic data may be negative for corporate activity, but if it increases expectations for lower interest rates, some equities can rise. The relevant question is therefore not simply whether news is good or bad in isolation, but how it compares with what the market had already expected.
Expectations Often Matter More Than the Headline
Suppose inflation prints at 4%. That may objectively still be high. But if the market expected 4.5%, the result is better than anticipated, which can change expectations for monetary policy and move stock indexes higher.
This is why trading directly from a headline can be difficult. Markets respond not only to the number itself, but to the gap between reality and consensus expectations.
Earnings Season Can Move an Entire Index
During S&P 500 earnings season, hundreds of companies release new information about revenue, profit, margins, guidance, capital expenditure, AI spending, consumer demand, and broader business conditions.
Because the largest companies carry disproportionate index weights, mega-cap earnings reports can have a major short-term influence on benchmark performance. There can be periods when a different large component moves the index almost every day.
An Index Is a Continuous Aggregation of Market Opinion
One useful way to think about an index is as a continuous aggregation of what millions of market participants collectively think about a group of companies. Greater optimism tends to push prices higher, while greater pessimism pushes them lower.
It is not a perfectly equal vote because different companies carry different weights, and derivative markets also incorporate changing expectations about the future. Still, the index compresses an enormous amount of information into one constantly changing number.
How a Beginner Can Approach Index Trading
A beginner does not need to start by asking which index can produce the highest return. A better approach is to choose one benchmark, such as the S&P 500, and learn its structure thoroughly.
What companies are inside it? How are they weighted? When is the underlying market open? Which macroeconomic reports tend to move it? Are you trading a CFD, futures contract, ETF, or another product? What is one point worth, what is the margin requirement, and what are the costs?
Those questions create a much stronger foundation than beginning with a buy or sell signal.
Then Learn the Instrument’s Behavior
Study when volatility tends to increase. Observe the New York open, major macro releases, FOMC decisions, earnings periods, typical daily ranges, support and resistance behavior, spreads, and overnight price action.
Understanding the instrument can be at least as important as understanding the strategy. A technically good entry can still become a poor trade if the trader does not understand the contract itself.
A Good Strategy Cannot Compensate for Not Knowing the Product
A trader can identify an excellent entry and still make a disastrous trade if they misunderstand the value of one point, do not know when financing is charged, fail to understand futures expiration, or accidentally open a position ten times larger than intended.
The strategy may be completely reasonable while the execution is dangerous because the trader did not understand what was actually being traded.
Financial Education Should Begin With the Instrument
Before asking where to buy or sell, the more fundamental question should be: what is this product? What sits underneath it, how is it calculated, how does it behave, how much is one point worth, and what risks come from the wrapper being used?
A good signal cannot protect someone who does not understand the instrument through which the signal is being traded.
Final Thoughts
An index is a rules-based benchmark that summarizes the performance of a defined group of securities. The S&P 500 uses float-adjusted market-cap weighting, the Nasdaq-100 uses modified market-cap weighting, and the Dow Jones uses price weighting. Their component companies move the benchmarks, but they do not necessarily influence them equally.
To trade those movements, investors and traders use financial products such as ETFs, futures, CFDs, and options. Those products are not interchangeable. They can differ significantly in leverage, margin, expiration, financing, liquidity, trading hours, and overall risk.
One advantage of index exposure is that company-specific risk is diluted across multiple components. That does not make an index risk-free, and leverage can turn a relatively modest index movement into a very large percentage move in a trading account.
The next time a platform shows a simple button such as US500 BUY, do not ask only whether you think the market will rise. Ask what the underlying benchmark is, how it is calculated, which companies dominate it, what one point is worth, which product you are using, whether leverage is involved, what the margin requirement is, what the costs are, and where the trade becomes invalid.
If you would like to learn more about how we think about markets and the mechanics behind our own automated trading system, you can find educational material and a closer look at how the system operates at SignalCrumbs.com .
When you trade an index, knowing where you think the market may go is only half the job. You also need to understand exactly which financial product you are using to express that view, because the same S&P 500 exposure inside an ETF, a futures contract, or a leveraged CFD can represent three very different trades.
 Related posts